Before starting, let me explain to you what “Logging” means in IT. It simply means the back-end logs which are generated when our application is running on the front-end. You can also say that these are the traces to check whether the application is working as expected or not. If not, we can find the issues or errors by checking the logs in the back-end, which helps us in debugging the same. In modern IT infrastructures, especially with large-scale systems, managing logs efficiently is crucial—and this is where Centralized Logging with ELK Stack becomes essential.
With Centralized Logging, you can trace/search through all of the application or server logs in a single place. Tracing the logs can help you to fix the issues related to your production server’s as well as the application’s running on those servers. As a result, every organization is now adopting the Centralized Logging System within its infrastructure.
Their many tools which can help you to create this Centralized Logging, but the most popular one is the ELK (Elasticsearch, Logstash, Kibana). Let me give a brief description of ELK.
- ‘E’ means Elasticsearch –> It is used for storing the logs.
- ‘L’ means Logstash –> It is used for shipping & processing the logs.
- ‘K’ means Kibana –> It is a web interface to view &analyze the logs.
Using ELK we can view, search, analyze the coming logs in real time. ELK provides the facility to see the past logs as well. It means we can fetch and analyze the logs during a specific time frame.
Architecture of ELK
Below diagram shows how an ELK stack looks like,

- Log:- These are the logs which we want to analyze for any issues in our application or production servers.
- Logstash:- This will help in collecting, parsing the logs that we want to analyze.
- Elasticsearch:- The parsed logs coming from Logstash are stored here.
- Kibana:- Finally, it will pick the stored logs from Elasticsearch and show them graphically in the dashboards.
Let’s understand all these components with more details.
What is Elasticsearch?
Elasticsearch is like a search engine plus NoSQL database, which means it can understand
any type of data. It is capable of storing all data internally which in-turn helps in making a quick search of the data. Due to its feature to store data centrally, we can search and analyze the big volume of data with ease.
Features & Benefits of Elasticsearch
- It is an open source search engine and is written in Java.
- It can index any kind of data. So, searching for data is very simple.
- Provides the facility to search the logs in real time.
- Can easily understand JSON language and have support for Multi-language & Geolocation.
- As its a NoSQL database, so storing a schema-less data is not a big deal.
- It is having many multi-document API’s to manipulate the data record-by-record.
- Can perform querying and filtering of data that has been passed to it.
- It can scale horizontally as well as vertically (as per your needs), which makes the searching of data more faster.
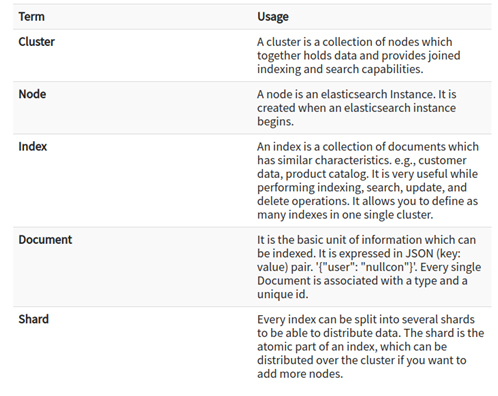
Some of the important terms used in Elasticsearch are,
What is Logstash?
Logstash is a tool to collect incoming data such as system logs, application logs, etc. It takes and parses the incoming data into the Elasticsearch. It can easily get all types of data from the multiple sources and makes it available to Elastisearch for further use. It is having three main components as shown below and they make use of a plugin to do their task.
Input:- Here we will define which logs to consider and have to pass to Logstash.
Filters:- Here we will decide the actions/conditions to perform on the coming data.
Output:- Here we have to give the details of our Elasticsearch server.
The logstash example configuration file looks like below with all the above components,
input {
file {path => “/data/input.csv” }}
filter {
csv {columns => [
“recordType”, “dateTime”, “productName”, “productCode”, “price”, “qty” ]}}
output {
elasticsearch {
hosts => [“${ESHOST}”]
index => “logstash-%{+YYYY-MM}”}}
Features & Benefits of Logstash
- It allows different inputs, filtering, parsing of your logs.
- It analyzes a large variety of structured as well as unstructured data/events.
- It is having many plugins that can easily connect with a variety of input sources & platforms.
What is Kibana?
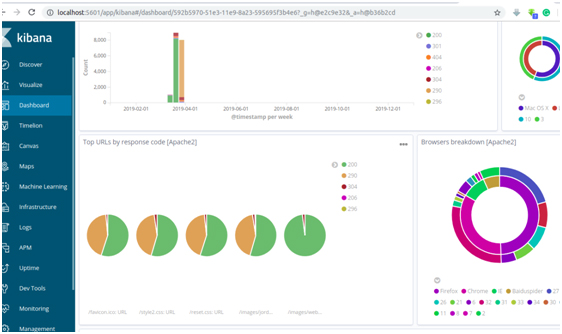
Kibana is a graphical data visualization tool which completes the ELK stack. It Kibana is basically an analytics and visualization platform, which lets you easily visualize data from Elasticsearch. Kibana comes with dashboards where you can create visualizations such as pie charts, line charts, and many others. There are a number of use cases of Kibana.
For example, a website owner can map website’s visitors onto a map and show traffic in real time. He can integrate website traffic coming from different browser’s and can see which browsers are important to support based on the customer base.
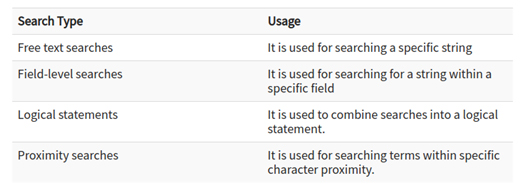
There are many different methods using which we can perform searches on our data. Below are the most common search types as shown in the diagram,
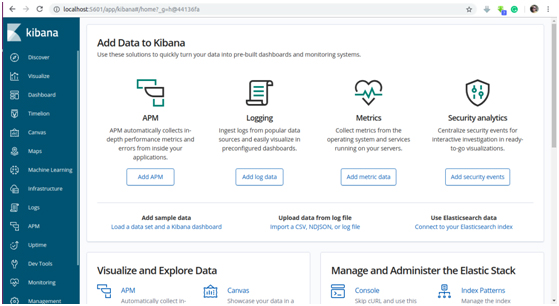
Below are some screenshots of Kibana web interface for your reference,
Features & Benefits of Kibana
- Using Kibana we can analyze our indexed data using graphs, line charts, bars charts, pie chart, etc.
- We can interpret the real-time data coming from the server’s/applications.
- One can create many dashboards and can also integrate multiple dashboards into a single dashboard.
- It provides the feature of analyzing data from the past as well, using its time frame mechanism.
- We can also save the newly created dashboards for future references.
Summary
Today we have learned why Centralized Logging with ELK Stack is so widely used and popular in the IT sector. Many big companies like LinkedIn, Netflix, StackOverflow, Accenture, HipChat, etc., have adopted ELK as their Centralized Logging System. ELK supports many different log management techniques & use cases including IT operations, website traffic, security events, business intelligence, customer support, etc. Hence, ELK is one of the main solutions that should be implemented in any organization wanting to keep their business up & running without fail.

